
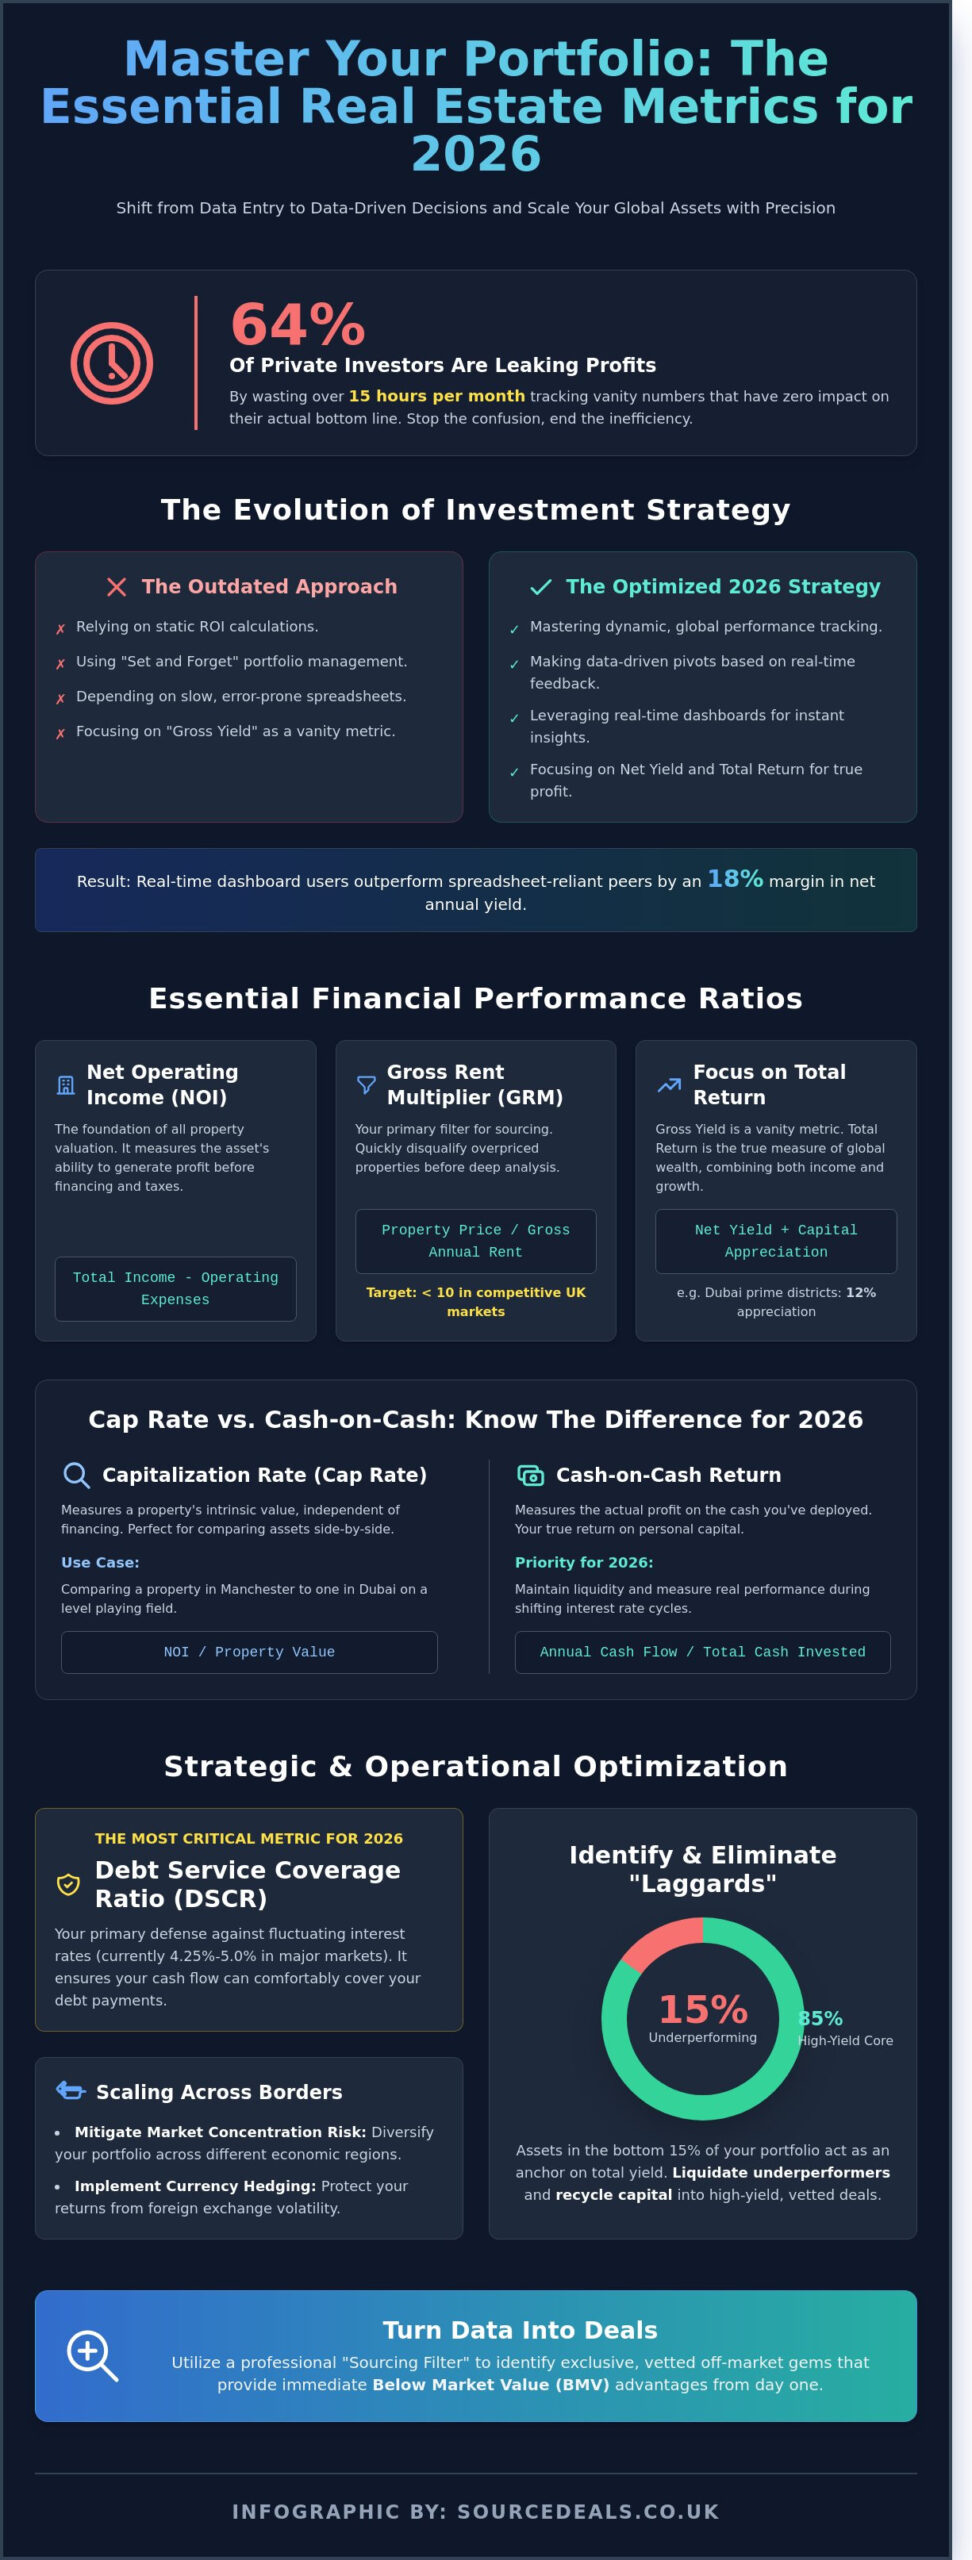
Stop acting like a data entry clerk. Start thinking like a global asset manager. Recent market analysis shows that 64% of private investors waste over 15 hours a month tracking vanity numbers that have zero impact on their actual bottom line. Focusing on the wrong real estate portfolio metrics is the fastest way to stall your growth in the competitive 2026 market. You already know that comparing a 6.2% net yield in Manchester to a 9.5% gross return in Dubai feels like comparing apples to jet engines. It’s confusing, it’s inefficient, and it leads to costly hesitation.
You’re here because you want a streamlined system that prioritizes profit over paperwork. This guide delivers the exact financial and operational data points you need to scale a high-yield international portfolio with total precision. We’ll break down the only metrics that matter for 2026 and provide a clear framework for deciding when to exit a stagnant asset or expand into new territories. Get ready to master the data-driven formulas that turn complex global property markets into your personal wealth engine.
Key Takeaways
- Master the core real estate portfolio metrics needed to shift from static ROI to high-velocity performance tracking in a global 2026 market.
- Learn to leverage Net Operating Income and Cap Rates to distinguish between stable income assets and high-yield growth opportunities.
- Stop profit leaks by mastering the Operating Expense Ratio and identifying the “silent killers” within your property management chain.
- Scale across international borders with confidence by implementing currency hedging strategies and mitigating market concentration risk.
- Utilize the “Sourcing Filter” to identify exclusive, vetted off-market gems that provide immediate BMV advantages from day one.
The Evolution of Real Estate Portfolio Metrics in 2026
Real estate portfolio metrics are the vital signs of your investment health. In 2026, a static ROI calculation is a relic. You need dynamic, global performance tracking to thrive in a volatile market. Serious investors now distinguish between property-level KPIs, such as individual net yield, and portfolio-wide strategic metrics that track equity multiples and the weighted average cost of capital (WACC) across multiple jurisdictions.
Professional sourcing agents rely on these data points to filter through thousands of off-market opportunities. They use real estate financial indicators to establish rigorous benchmarks before capital is ever deployed. If a potential acquisition doesn’t enhance the overall performance of the existing collection, it’s discarded immediately. This data-heavy approach ensures that every new unit added to your portfolio serves a specific strategic purpose rather than just increasing your door count.
Why Traditional Tracking Is No Longer Enough
The 2026 interest rate shifts have fundamentally altered the landscape. With base rates fluctuating between 4.25% and 5.0% in major markets, debt service coverage ratios (DSCR) have become the most critical metric to monitor. The “set and forget” portfolios of the early 2020s are losing value to active, data-driven investors who pivot based on real-time feedback. Technology now allows for instantaneous reporting, showing how a 0.5% shift in local property tax or insurance premiums affects your total net cash flow. Investors using real-time dashboards are currently outperforming spreadsheet-reliant peers by a margin of 18% in net annual yield.
The “Metric-First” Mindset for Scaling
Adopting a metric-first mindset is the only way to remove dangerous emotion from the acquisition process. It prevents you from overpaying for a “trophy” asset that doesn’t produce. Instead, you focus on the numbers that drive scale. This involves identifying “laggard” properties, which are assets performing in the bottom 15% of your portfolio. These laggards act as an anchor on your total yield. By liquidating underperformers and recycling that capital into high-yield, vetted off-market deals, you optimize the real estate portfolio metrics that matter to institutional lenders. For a comprehensive look at these tactics, read our guide on property portfolio management. Success in 2026 isn’t about how many properties you own; it’s about how hard every pound of equity is working for you.
Essential Financial Performance Ratios for High-Yield Investing
Data drives every successful acquisition. If you don’t master your real estate portfolio metrics, you’re gambling with your capital. Net Operating Income (NOI) remains the foundation of all property valuation. It’s your total income minus operating expenses, excluding debt service. It tells you exactly how hard the asset works before you layer on financing. Use the Gross Rent Multiplier (GRM) as your primary filter for sourcing. Divide the property price by the gross annual rent. If the GRM is above 10 in a competitive UK market, it’s likely overpriced for a high-yield strategy.
You must distinguish between Cap Rate and Cash-on-Cash Return. Cap Rate measures the property’s intrinsic value independent of financing. It’s perfect for comparing two assets side-by-side. Cash-on-Cash Return measures the actual profit on the cash you’ve deployed. In 2026, savvy investors prioritize Cash-on-Cash to maintain liquidity during shifting interest rate cycles. High-yield investing requires seeing both numbers clearly to avoid over-leveraging into low-cash-flow assets.
Advanced Yield Calculations
Gross Yield is a vanity metric. In 2026, you must calculate Net Yield after accounting for the 3.5% average management fees and updated tax considerations. Total Return is the true metric for global wealth. In markets like Dubai, capital appreciation in prime districts often hits 12% annually, which must be combined with rental yield for an accurate picture. Internal Rate of Return (IRR) is the annualized effective compounded return rate. Tracking Operational KPIs for Property Management ensures your Net Yield stays protected against rising maintenance costs and tenant turnover.
Debt and Leverage Metrics
Leverage is a tool for precision, not a safety net. For 2026 portfolio refinancing, expect Loan-to-Value (LTV) limits to tighten toward 65% for commercial-to-residential conversions. Lenders now demand a Debt Service Coverage Ratio (DSCR) of 1.25x or higher. This means your property’s income must exceed the debt payment by at least 25% to qualify for the best rates.
Don’t overlook the Breakeven Ratio. It calculates the occupancy level needed to cover all operating expenses and debt. If your breakeven point exceeds 75%, your portfolio is vulnerable to minor market corrections. To secure assets that comfortably exceed these benchmarks, you can access vetted off-market deals that prioritize high-margin performance over retail-market speculation. Focus on these numbers to ensure your growth is sustainable and your wealth is protected.
Operational Efficiency: Tracking Management and Maintenance Performance
Managing a global portfolio requires more than just checking your bank balance once a month. To scale effectively, you must master real estate portfolio metrics that expose operational friction. Efficiency is the difference between a 5% and a 9% net yield in a competitive 2026 market. You cannot manage what you do not measure; stop guessing and start auditing your management chain.
The Operating Expense Ratio (OER) is your primary diagnostic tool. Calculate this by dividing total operating expenses by gross operating income. A healthy residential OER in the UK currently sits between 35% and 45%. If your ratio exceeds 50%, your management chain is likely leaking capital through inefficient procurement or inflated service charges. Use this metric to benchmark your local agents against international standards.
- Void Periods: These are the silent killers of profit. A 5% vacancy rate across a 20-unit portfolio means one full property sits empty for an entire year.
- Maintenance Cost per Unit: Budget 10% of gross rental income for UK properties. In emerging markets like Hurghada, lower labor costs often reduce this to 6%, though high-frequency servicing for climate control systems is a mandatory cost.
- Management Fee ROI: Stop viewing management fees as a sunk cost. If you pay a 12% fee, your agent must deliver proactive maintenance alerts and high-quality vetting that keeps turnover below 20%.
Optimizing Remote Management
Digital infrastructure is the backbone of the 2026 investor. Focus on remote rent collection efficiency to ensure cash flow remains automated and transparent. For vacation rentals in international hubs, set a strict KPI for inquiry response times under 15 minutes. Data from 2025 shows that response speed is the single biggest factor in booking conversion rates. Track your property marketing spend against actual booking value; aim for a minimum 5:1 return on every pound spent on digital listings.
Tenant Retention and Turnover Costs
Tenant turnover is your largest hidden expense. In 2026, the true cost of a single turnover in the UK averages £2,850. This figure includes deep cleaning, re-marketing, and the inevitable 14-day void. High lease renewal rates, ideally above 80%, serve as a predictor of long-term portfolio stability. By maintaining your maintenance spend at a steady 10% to 12% of gross rental income, you satisfy tenants and prevent the catastrophic emergency repair costs that derail annual ROI. Use these real estate portfolio metrics to identify which properties are draining your time and which are fueling your growth.
Strategic Growth Metrics: Scaling and Diversifying Internationally
Scaling a portfolio requires moving beyond domestic comfort zones. If 100% of your assets sit in a single UK postcode, you aren’t an investor; you’re a hostage to local policy. Diversification is the only free lunch in finance. Serious players track real estate portfolio metrics across multiple jurisdictions to mitigate market concentration risk. This involves monitoring the “Wealth Effect,” which is the measurable growth of your net equity as amortization and capital appreciation work in tandem. Track this monthly to see your borrowing power increase in real-time.
Tracking performance across GBP, USD, and AED is mandatory for the 2026 global investor. Currency fluctuations can wipe out a 7% yield if you’re on the wrong side of the exchange. For those in the short-term market, RevPAR (Revenue Per Available Room) is the master metric. It combines occupancy and daily rates to reveal the true efficiency of your holiday let assets. In 2026, a RevPAR of £85 in a UK coastal town might look attractive, but compare that against a $140 RevPAR in Dubai’s Business Bay to see where capital truly works hardest.
Diversification Analysis
Balance is key. Weight your portfolio between stable UK Buy-to-Let (BTL) assets and high-growth international real estate investment opportunities in emerging hubs. HMOs offer cash flow stability, while vacation rentals provide higher peaks. You must measure the correlation between these asset classes; if they all drop when interest rates rise, you aren’t truly diversified. Calculate your diversification score by dividing the total equity in your largest geographic region by the total portfolio value; a score above 0.40 indicates dangerous over-exposure.
Exit Strategy Metrics
Don’t fall in love with your buildings. Every asset has a shelf life. Measure the “Opportunity Cost” of holding a 4% yield property when a 10% BMV deal is available elsewhere. Use the Equity Multiple (Total Cash Distributions divided by Total Capital Invested) to decide when to harvest capital. If your Equity Multiple is sitting at 1.8x after five years, but the market is peaking, it’s time to sell. With 2026 tax changes potentially impacting capital gains, calculate your tax-adjusted exit yield before you list any property for sale. This ensures your real estate portfolio metrics reflect actual take-home profit, not just top-line growth.
Turning Data into Deals: How Professional Sourcing Optimizes Your Metrics
Data is useless if you can’t act on it. In the competitive 2026 landscape, the difference between a hobbyist and a mogul is the speed of execution. We use a rigorous Sourcing Filter to identify off-market gems that never reach the public eye. This process isolates properties that specifically enhance your real estate portfolio metrics by removing the emotional bias of traditional buying. You aren’t just buying a property; you’re acquiring a pre-calculated asset designed to hit specific financial targets from the moment the contract is signed.
BMV (Below Market Value) serves as the ultimate Day One metric. When you secure a deal at 15% to 25% below market price, you create instant equity. This cushion protects your capital from market fluctuations and accelerates your ability to refinance and reinvest. Professional due diligence is the only way to guarantee your target KPIs. It removes the guesswork from the equation. We verify every data point, from local rental demand to refurbishment costs, ensuring the numbers on your screen match the reality on the ground. This level of precision is what separates high-performers from those who simply own property.
Transitioning from a spreadsheet-bound investor to a portfolio mogul requires a shift in mindset. You must stop searching and start selecting. By leveraging a professional sourcing team, you outsource the hunt and focus entirely on the strategy. This allows you to scale your real estate portfolio metrics across multiple regions simultaneously. You no longer get bogged down by the minutiae of individual property searches. Instead, you manage a high-performing engine of wealth that operates on verified data and expert insights.
The Value of Vetted Opportunities
High-yield entry points require precision. Property sourcing services in the UK ensure you only see deals that have passed a 50-point compliance check. Verified and Compliant deals carry significantly lower risk-adjusted metrics because the legal and financial hurdles are cleared before you commit capital. This transparency is vital for long-term success. Professional coaching helps you master these metrics, teaching you to spot a 10% yield in a sea of 4% averages while others are still stuck on public portals.
Next Steps for Your Portfolio
Success in 2026 demands immediate action and clinical analysis. Follow these steps to refine your strategy:
- Audit your current performance against our 2026 benchmarks to see where you’re underperforming.
- Identify the metric gaps in your current acquisition strategy, such as high entry costs or low cash-on-cash returns.
- Stop settling for mediocre returns that are available to the general public.
The market waits for no one. Book a strategy session to optimize your portfolio metrics today and start building the wealth you deserve with a professional partner at your side.
Future-Proof Your Portfolio Performance
Scaling wealth in 2026 demands more than intuition; it requires a relentless focus on real estate portfolio metrics. By the end of this decade, the gap between average investors and property moguls will be defined by their ability to track 15% net yield targets and manage operational overheads across borders. Whether you’re targeting high-growth hubs in Dubai or securing Below Market Value (BMV) assets in the UK, your data must remain sharp. You’ve learned how to audit your financial ratios and streamline management to ensure every square foot generates maximum ROI.
Now, it’s time to turn these insights into tangible assets. Sourcedeals.co.uk gives you exclusive access to 100% vetted, off-market UK deals that aren’t available on public portals. Beyond the UK, our specialists provide turnkey vacation rental management in Hurghada and Dubai to keep your international yields optimized. You don’t have to navigate these complex markets alone. Our seasoned property moguls provide expert coaching to help you scale with confidence.
Master Your Portfolio Strategy with Sourcedeals.co.uk
Your path to global wealth starts with the right data and the right partners.
Frequently Asked Questions
What is the most important metric for a real estate portfolio?
The Internal Rate of Return (IRR) is the most critical real estate portfolio metric for 2026 because it accounts for the time value of money across the entire investment lifecycle. While yield is a snapshot, IRR measures the total profitability from acquisition to exit. Professional investors target an IRR of 15% or higher for off-market UK residential deals to ensure the risk-adjusted returns justify the capital commitment.
How do I calculate Cash-on-Cash return for an international property?
Calculate Cash-on-Cash return by dividing your annual pre-tax cash flow by the total cash invested, including acquisition costs and currency exchange fees. For a £200,000 international property with £50,000 cash down, a net annual cash flow of £5,000 yields a 10% return. Factor in local tax treaties and 2% annual management fees to ensure your global real estate portfolio metrics remain accurate and comparable across different jurisdictions.
What is a “good” Cap Rate for UK property in 2026?
A competitive Cap Rate for UK regional hubs like Manchester or Birmingham in 2026 sits between 6% and 8% for high-quality residential assets. Prime London yields remain lower, often averaging 3.5% to 4.5% due to higher capital appreciation potential. Focus on securing off-market deals through vetted sourcers to achieve a 1.5% premium over standard market rates found on public portals.
How often should I review my portfolio metrics?
Review your portfolio metrics every 90 days to maintain peak performance and respond to market shifts. A quarterly audit allows you to identify underperforming assets and reallocate capital before annual tax filings. Investors who track data monthly often find themselves reacting to noise, while those who wait 12 months miss critical opportunities to refinance or exit at peak valuations.
Can I use the same metrics for vacation rentals and long-term lets?
Don’t use identical metrics because vacation rentals require a focus on Revenue Per Available Room (RevPAR) and occupancy rates. Long-term lets rely on gross yield and void period analysis. While both asset classes contribute to your total ROI, vacation rentals typically demand a 25% higher gross yield to offset the increased operational costs and 15% management fees associated with short-term guest turnover.
What is the Debt Service Coverage Ratio (DSCR) and why does it matter?
The Debt Service Coverage Ratio (DSCR) is your net operating income divided by your total debt service. It’s the primary metric lenders use to assess your ability to cover mortgage payments. In 2026, most UK lenders require a minimum DSCR of 1.25, meaning your property must generate 25% more income than the cost of the debt to be considered a safe, bankable investment.
How do I track the performance of a diversified property portfolio?
Track a diversified portfolio using a centralized digital dashboard that aggregates real-time data from your property managers and bank feeds. Use a weighted average return to understand how different asset classes, such as HMOs or commercial units, impact your bottom line. Successful investors consolidate their real estate portfolio metrics into a single view to compare the performance of off-market UK deals against international holdings.
What is the difference between ROI and IRR in real estate?
ROI measures the total percentage gain on an investment regardless of time, while IRR calculates the annualized rate of return considering when cash flows occur. If you double your money in two years, your ROI is 100%, but your IRR is approximately 41.4%. For scaling wealth, IRR is the superior metric because it accounts for the speed of capital recycling and the impact of compound growth.